Station Info
Feels like: --
--
Raw METAR Report
Updated: --
Loading METAR...
Temperature
--
Dew Point
--
Humidity
--
Wind
--
--
Pressure
-- hPa
Clouds and Ceiling
--
Ceiling: --
Visibility & Flight Category
--
VFR: Ceiling > 3,000ft, Visibility > 5mi
MVFR: Ceiling 1,000-3,000ft, Visibility 3-5mi
IFR: Ceiling 500-1,000ft, Visibility 1-3mi
LIFR: Ceiling < 500ft, Visibility < 1mi
Weather Conditions Timeline
Next Hour Forecast
Model Information
TEMPERATURE
WIND SPEED
HUMIDITY
DEW POINT
CEILING HEIGHT
VISIBILITY
ATMOSPHERIC PRESSURE
CLOUD COVER
WIND DIRECTION
ModerateConfidence Guide
Model Performance
Global Intelligence Model (GIM) Predictions
Select up to 2 variables from the cards on the left to compare
Extended Forecast (12h)
Ensemble Models
Climate Information
TEMPERATURE
WIND SPEED
PRESSURE
HUMIDITY
DEW POINT
VISIBILITY
CEILING HEIGHT
CLOUD COVER
WIND DIRECTION
GIM v2.0 Advanced Predictions
Extended 12-hour forecast analysis with ensemble models
📊 v2.0 Adaptive Predictability Analytics
📊 ADP Performance Validation
R² validation scores across all climate zones, variables, and extended horizons (1h-12h). Updated daily with 270 validation points. • Click to enlarge
🎯 ADP Extended Horizon Intelligence
Adaptive training window selection (7/30/60/90 days) optimized for each variable and forecast horizon. System automatically selects optimal historical data window. • Click to enlarge
🎯 Dual-Algorithm Selection
Dual-Algorithm selection (7/30/60/90 days) for each variable and forecast horizon. System automatically selects optimal algorithm (linear vs random forest) for daily predictions. • Click to enlarge
The Global Intelligence Model (GIM) System Performance
Comprehensive monitoring and analytics for GIM forecasting systems
GIM Run-time Metrics | Hourly Cycles | SLA less < 60 minutes
Real-time monitoring of the GIM forecasting system runtime performance over the last 72 hours. Each data point represents the total execution time for generating predictions across 5,000+ stations. The system maintains a 60-minute SLA for operational reliability, with runtime variations indicating changes in data availability, processing load, or computational efficiency across model versions.
🌍 Global METAR Stations Health | Data Freshness < 2 hours
Freshness Trends Over Time
Monitors real-time health of +5,000 global METAR stations with data freshness defined as reports received within the last 2 hours. Performance is analyzed across five Köppen climate zones with 24-hour trend tracking to identify network degradation or regional outages. Maintaining high data freshness is critical for the reliability of the daily ML model training pipeline and the operational forecast accuracy.
📊 Daily R² Performance Trends
Daily model performance tracking across all GIM versions. The left panel shows v2.0 horizon degradation (1h to 12h) with today's forecast (cyan) compared against the ensemble average (white). Historical data (red) should show daily r2 trends. The right panel displays a 1-hour forecast comparison across all versions with auto-scaled precision for detecting subtle performance shifts. Automated export runs daily at 6:30 AM, processing validation metrics from the previous training cycle.
⏰ Daily Operations Monitor
Last 7 days performance monitoring • Problem detection • Click to enlarge
📈 Future Analytics
🔥 Performance Heatmaps
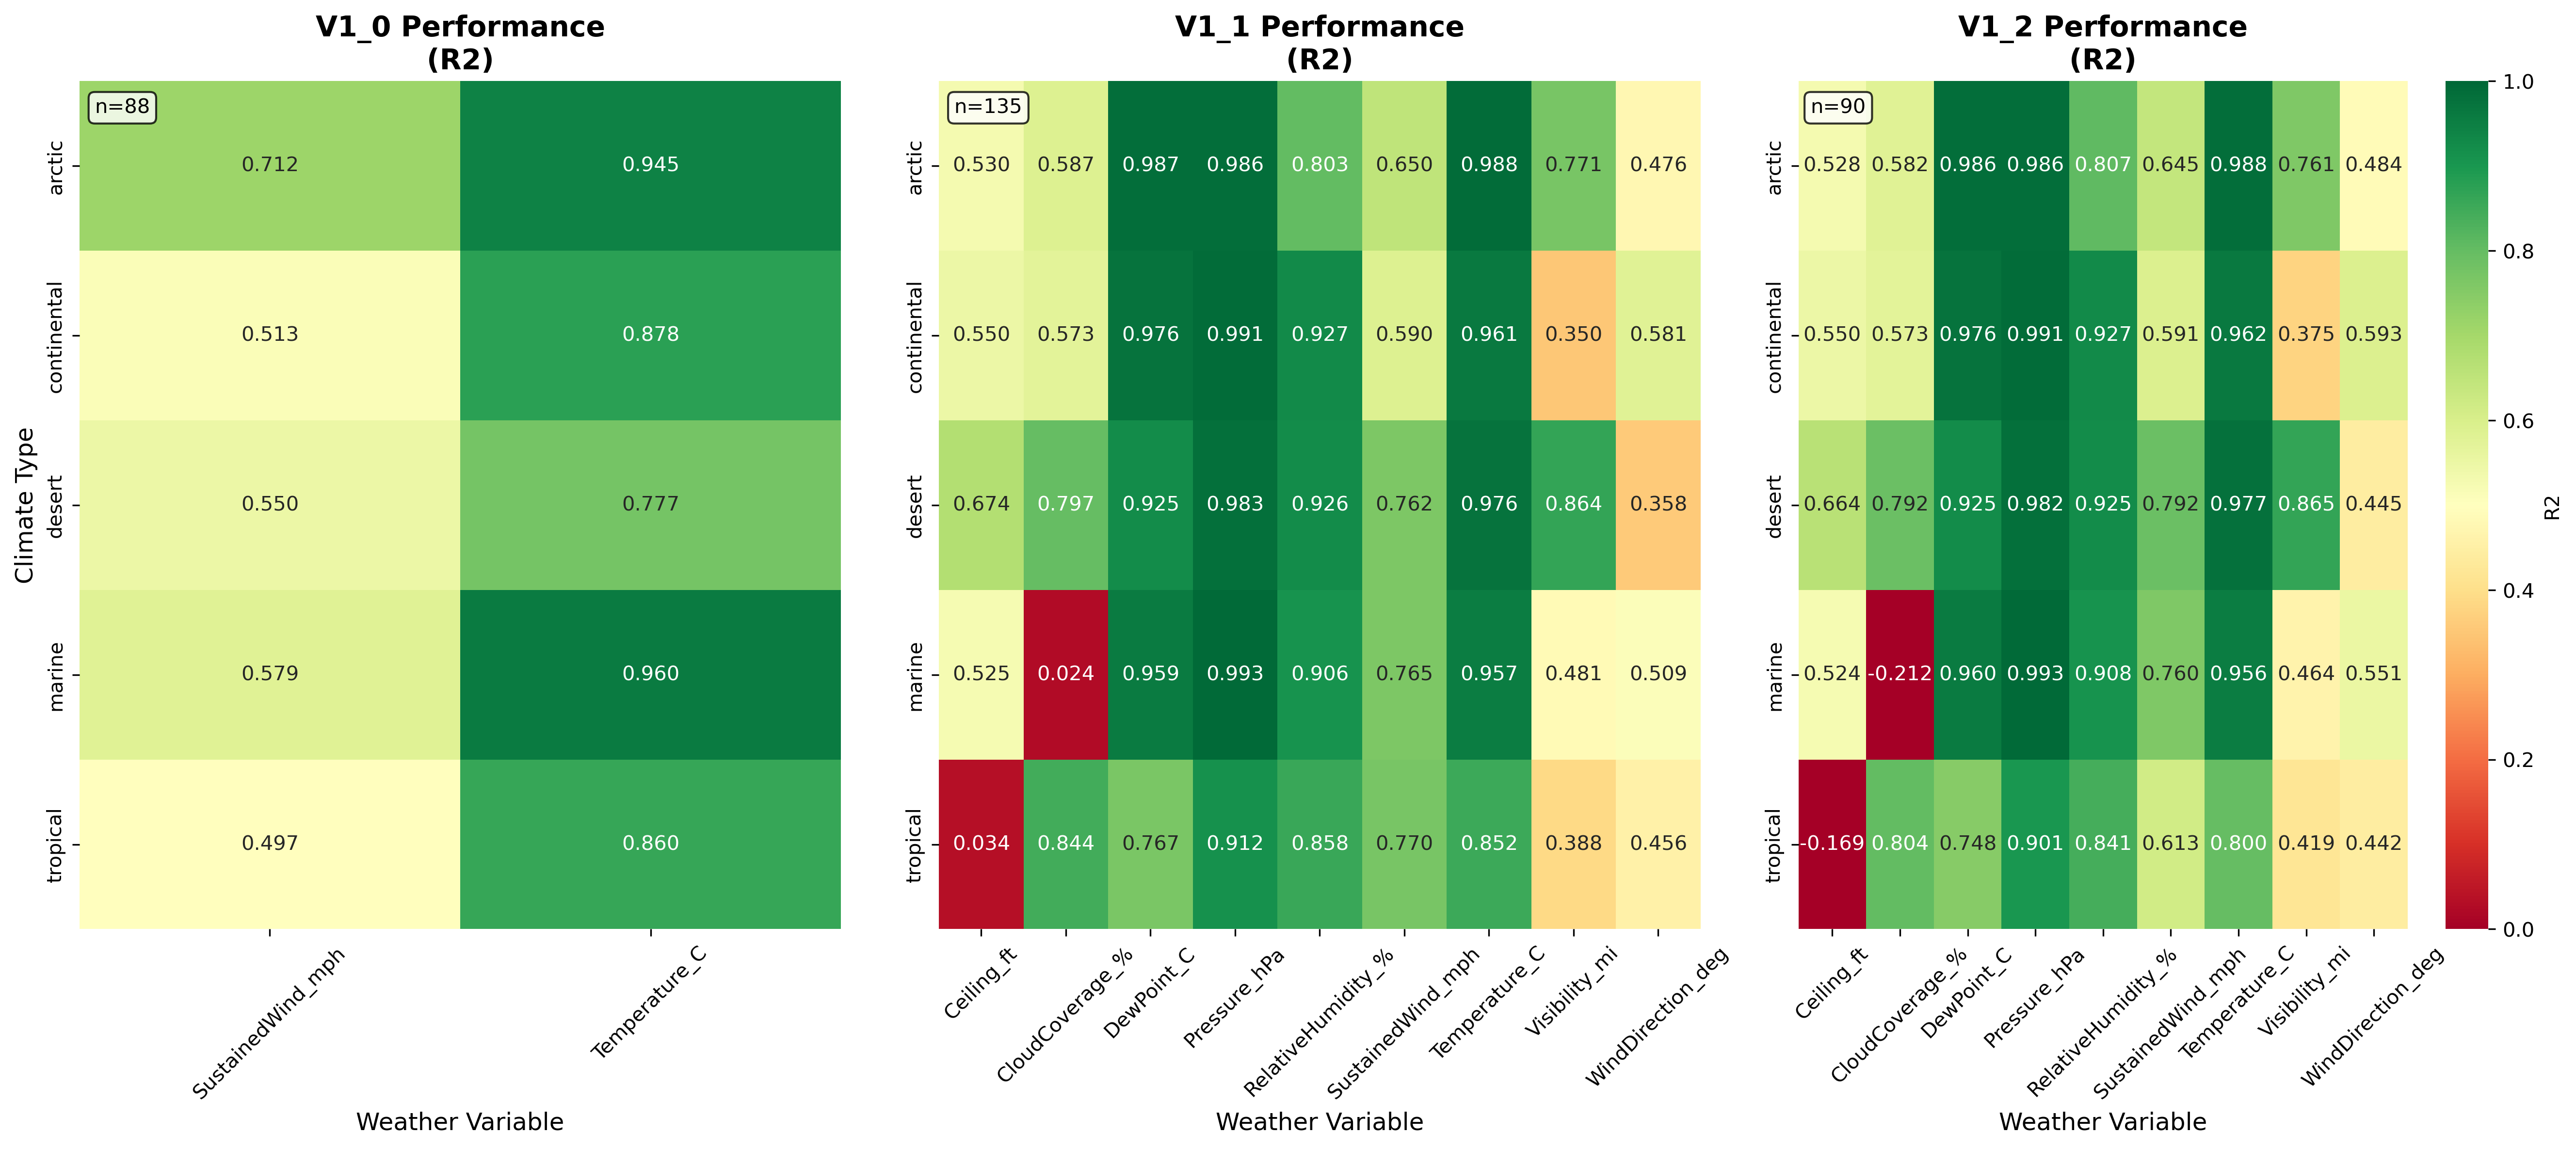
R² Performance across all model versions and climate zones • Click to enlarge